The color of us (continued)
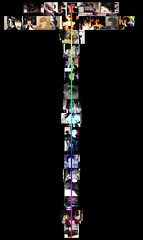
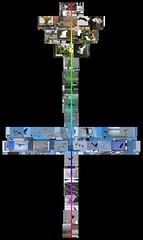
In order to understand the MOB Brown / orange shift phenomenon I’ve discussed in the previous post and elsewhere, I produced a series of histograms, showing the relative proportions of images in each set that average to a particular hue.
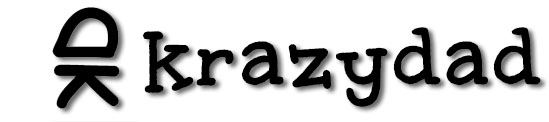
In this collection of photographs of poppy flowers, you can see a clear preponderance of orange photos.
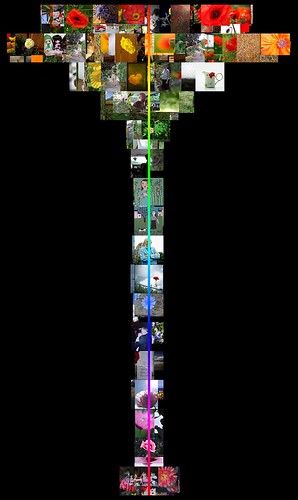
Of course, that’s not surprising, since poppy blossoms are often orange. But check out the distribution of hues in this collection of 10,000 photos from the Flickr Central group – a set of photos from a very diverse group of people, which isn’t intentionally color correlated.
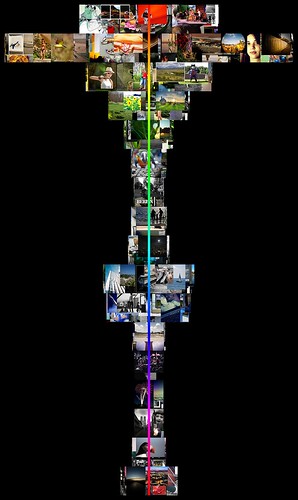
The same shift occurs in this collection of computer generated art…
In this collection of photos tagged “white wedding”…
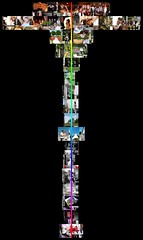
And in Auntie P’s collection of 360 self portraits.
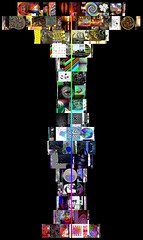
You can even see an orange bump in this collection of images of Birds in Flight, even though most of the images were taken against a blue sky.

August 7th, 2009 at 6:21 pm
I’ll be interested to read if you have a hypothesis on why red / orange is such a dominant colour…
August 7th, 2009 at 6:24 pm
NM…I guess I should’ve been reading your blog back in 2006 when you actually posted some hypotheses…I should follow links more often.
August 8th, 2009 at 1:52 pm
How did you make these histograms?
August 8th, 2009 at 6:24 pm
As with much of the image manipulation I do with Flickr, I wrote a Perl script that uses the Image::Magick library. This particular script reduces each image to a single pixel, then converts the resultant RGB value to HSB (hue, saturation, brightness). The hue is used to increment one of 17 buckets, which determine the widths of each horizontal bar. Then I loop through the images again, and render each one somewhere within their corresponding bar. Finally I composite the hue stripe in the middle onto the image. The hue stripe was precomputed in a separate script.
August 9th, 2009 at 10:35 am
How do you count pixels that do have a saturation of 0? The typical RGB2HSV formula will give you a hue of 0 for those although it is really undefine so maybe that explains the heap at red ( where normally hue = 0 )?
August 9th, 2009 at 1:47 pm
Ah, good catch! I updated the algorithm to evenly distribute the low-saturation images just now, randomizing the calculated hue if the saturation falls below 10%.
Most of the histograms were largely unaffected, but a few that had prominent red bumps, due to a surplus of B&W images (Auntie P, Computer Generated, White Wedding) now show less of a red bump, but the orange bump remains (and is in fact more consistent). I’ve replaced those images in the post. Take a look…
August 9th, 2009 at 9:05 pm
Thanks for the description of your scripts.